
Churn rate is the share of the customers you had at the start of a period who left during it. To calculate it, divide the customers lost from that starting group by the number you started with, then multiply by 100. If you start the month with 1,000 customers and 50 leave, your monthly churn rate is 5%.
That formula takes one line. Producing a number that means the same thing in April as it did in January takes a few decisions first, and those decisions are where most churn arguments come from. Below are the formula and its variants, a worked SaaS example, churn in mobile games and apps where nobody formally cancels, the monthly-to-annual conversion, and a way to judge the number you end up with.
What is the churn rate formula?
The standard customer churn rate formula is
Churn rate = (customers lost during the period ÷ customers at the start of the period) × 100
The same shape works for revenue. You swap customer counts for money and decide whether expansion revenue offsets what you lost.
| Metric | Formula | What it answers |
|---|---|---|
| Customer churn rate | Customers lost ÷ customers at start × 100 | How many accounts or users left |
| Gross revenue churn rate | Revenue lost from cancellations and downgrades ÷ revenue at start × 100 | How much recurring revenue walked out |
| Net revenue churn rate | (Recurring revenue lost from the starting customers − expansion revenue from the same customers) ÷ recurring revenue at start × 100 | Whether revenue from the starting customers shrank or grew (a negative value means it grew) |
Compute customer churn and revenue churn side by side. If the 50 customers who left were your smallest accounts, customer churn is 5% while revenue churn might be 2%. If they were your largest, revenue churn comes out higher than customer churn. Each one is correct, and they describe different problems.
Lock three decisions before you calculate
You cannot calculate churn until three things are settled. Most churn disagreements trace back to one of them, so write the choices down next to the number.
- What you are counting. Customer churn counts customers who left. When each customer is a business account, it is often called logo churn. For subscriptions, keep cancellations and churn apart. A cancellation request is one event, and churn is the date paid access actually ends, including failed renewals (often called involuntary churn). Revenue churn counts the money that left. When one person quotes customer churn and another quotes revenue churn, both can be right and still disagree, so say which one you mean every time.
- The time window. Monthly, quarterly or annual. A weekly rate, a monthly rate and an annual rate can all be correct and still look unrelated. Pick one window, label it, and convert other figures to it with the compounding formula further down.
- The denominator. Use the customer count at the start of each period, and apply the same definition every period. The hard case is customers who sign up and leave inside the same period. Leave them out of both the starting count and the customers lost, and report them separately as early churn, so the main rate stays comparable month to month.
A worked SaaS example
Here is one month for an example subscription business, with round numbers so the arithmetic stays visible.
| Item | Value |
|---|---|
| Customers at the start of the month | 1,000 |
| Customers who cancelled during the month | 50 |
| New customers who signed up during the month | 200 |
| Monthly recurring revenue (MRR) at the start | $100,000 |
| MRR lost from cancellations and downgrades | $4,000 |
| MRR gained from upgrades by existing customers | $1,500 |
Customer churn is 50 ÷ 1,000 × 100, which is 5%. The 200 new customers do not enter the calculation, because they were not part of the starting base.
Gross revenue churn is $4,000 ÷ $100,000 × 100, which is 4%. Net revenue churn is ($4,000 − $1,500) ÷ $100,000 × 100, which is 2.5%. In this example the business loses customers faster than it loses revenue, which usually means the customers who leave are smaller than average.
Watch the denominator here. If someone divides the 50 lost customers by the 1,200 who were around at some point in the month, churn looks like 4.2%. Only the denominator changed.
How does churn work in mobile games and apps?
A subscription has a cancellation date. A free-to-play game or a free app usually does not, because players simply stop opening it. So churn in games and apps is defined by inactivity. You decide what counts as active, pick a number of days, and treat anyone who has not returned within that window as churned.
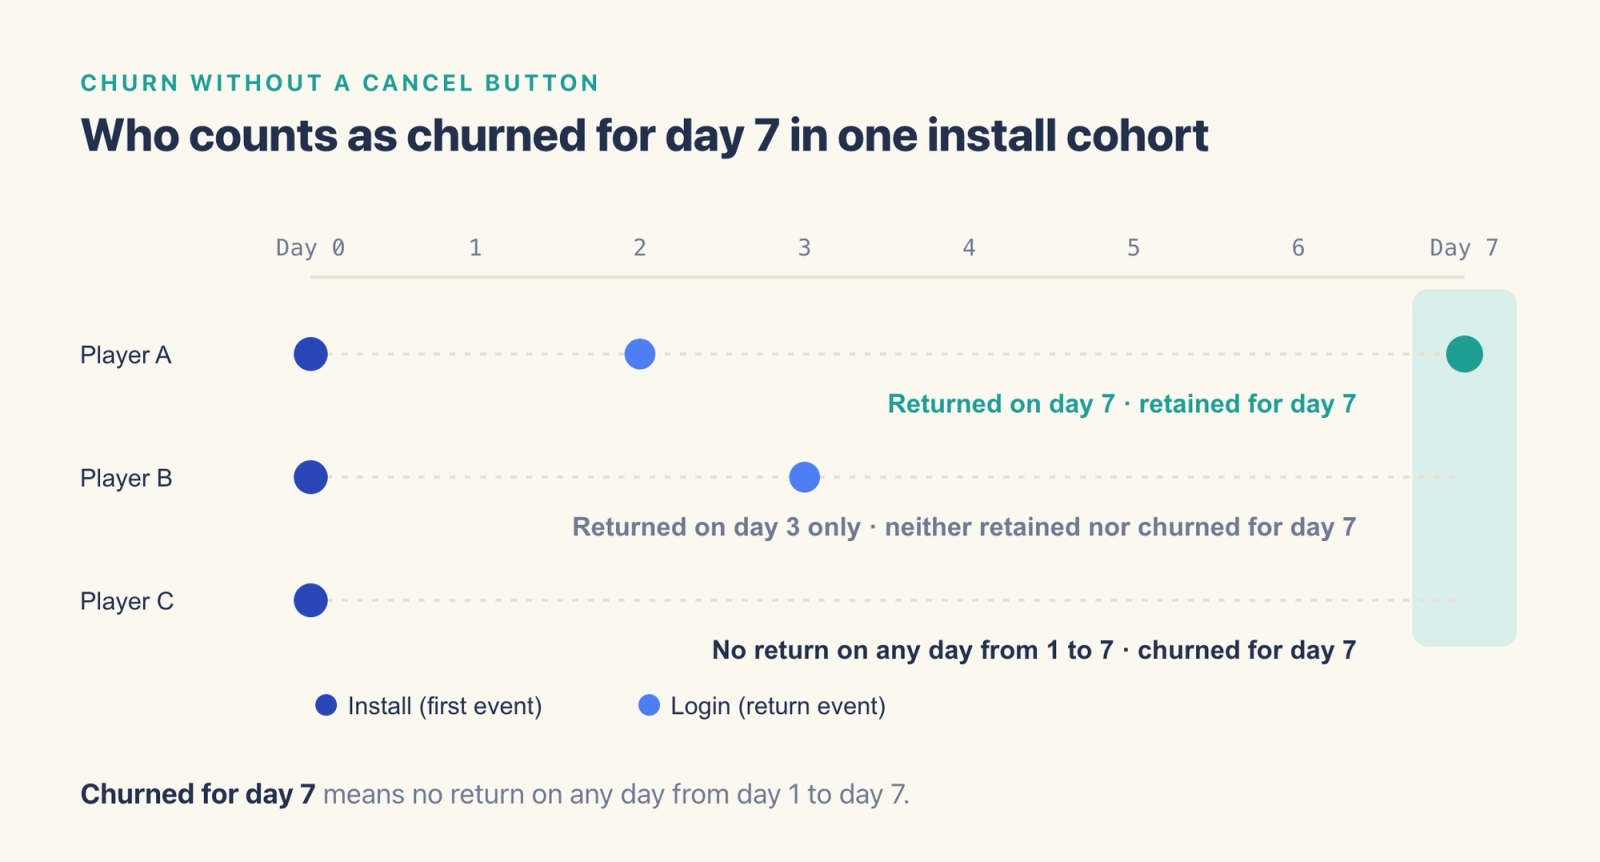
Here are the definitions from our product documentation. A user who completed the first event on a given day but did not complete the return event on any day from day 1 to day N after that date counts as churned for day N. A user who did return on day N counts as retained for day N.
- The first event. Usually install, registration or first login. This sets which cohort each player belongs to.
- The return event. Usually a login or a session start. Some teams use a core action, such as finishing a level, so that opening the app and closing it again does not count as active.
- N, the window. With a 7-day window you get a fast answer, and you also flag players who were only taking a break. With 30 days you avoid most of that, at the price of waiting a month.
Here is an example. A mobile game has 10,000 players who installed on the same day. By day 7, 7,400 of them have not come back on any day since install. The 7-day churn for that install cohort is 7,400 ÷ 10,000 × 100, which is 74%, and 26% returned at least once during days 1 through 7. Compare that number with the same window for earlier install cohorts before you draw a conclusion from one cohort.
Under these definitions, day N retention and day N churn can add up to less than 100%. A player who came back on day 3 and stayed away on day 7 is neither retained nor churned for day 7. That is one reason game teams usually report retention, which is also easier to plot as a curve. Our guide to calculating app retention rate covers day 1, day 7 and day 30 (D1, D7 and D30) retention from the same data.
How do you convert monthly churn to annual churn?
You cannot multiply monthly churn by 12. Each month you lose a share of a base that has already shrunk, so the losses compound. For a cohort whose monthly churn stays roughly constant, the conversion is
Annual churn = 1 − (1 − monthly churn)^12
| Monthly churn | Annual churn | Customers remaining after 12 months, out of 100 |
|---|---|---|
| 2% | 21.5% | 78 |
| 3% | 30.6% | 69 |
| 5% | 46.0% | 54 |
| 7% | 58.1% | 42 |
| 10% | 71.8% | 28 |
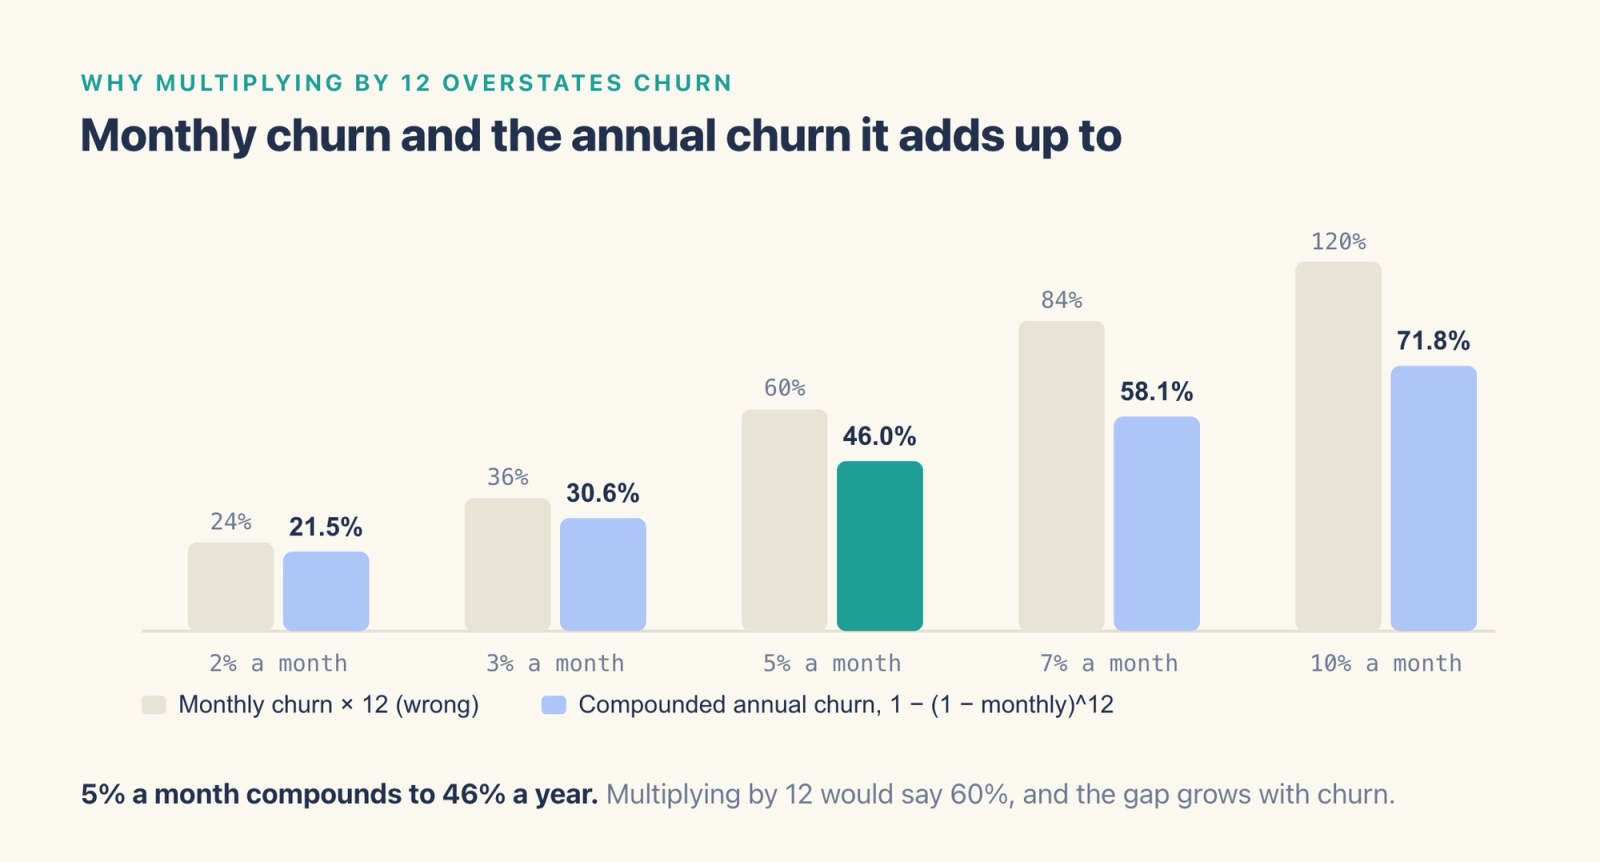
Multiplying 5% by 12 would suggest you lose 60% of customers in a year. The compounded figure is 46%, so the shortcut gives a number that is too high, and the gap grows as monthly churn rises. Going the other way, monthly churn = 1 − (1 − annual churn)^(1/12). When the monthly rates differ, multiply the twelve monthly survival rates together, (1 − January churn) × (1 − February churn) and so on, and subtract the result from 1.
Is a 5% churn rate good?
It depends on the business model and the window, so start by asking which churn and which period the 5% refers to.
For consumer subscription apps, published data gives some context. RevenueCat's State of Subscription Apps 2025 reports that nearly 30% of annual subscriptions are canceled in the first month, and that most apps with cheap annual plans keep up to 36% of users after a year, while high-priced monthly plans keep just 6.7%. A steady 5% monthly churn leaves about 54% of subscribers after a year. Those figures cover different plans and price tiers, so treat them as context and compare yourself with cohorts on the same plan length and price.
For B2B software sold on annual contracts, a monthly rate is often the wrong lens. A steady 5% a month compounds to about 46% a year, so it would mean losing almost half of your customers. Annual-contract businesses usually measure churn at renewal, by contract cohort.
For free-to-play games and free apps, a monthly churn rate is less useful than day N churn and retention by install cohort. Judge your 7-day or 30-day figure against your own earlier cohorts on the same platform and in the same markets, because published game benchmarks use different definitions and samples.
What does 10% churn mean? At 10% a month, you keep about 28 of every 100 customers after a year. For a subscription business that is a signal to look at onboarding, pricing and the first billing cycle, where early cancellations tend to cluster.
How does churn rate affect LTV?
In a simple subscription model with steady churn, lifetime revenue per customer is the average revenue per customer per month divided by the monthly churn rate. Multiply lifetime revenue by gross margin to estimate lifetime gross profit. The average customer lifetime in months is 1 ÷ monthly churn, so when churn is lower, each customer keeps paying for more months.
| Monthly churn | Average lifetime | Lifetime revenue at $10 per customer per month |
|---|---|---|
| 10% | 10 months | $100 |
| 5% | 20 months | $200 |
| 2.5% | 40 months | $400 |
Halving churn doubles lifetime revenue in this simple model. This simple calculation treats churn as constant over a customer's life. In practice early months lose more customers than later ones, and games rarely earn the same amount each month, so cohort-based LTV is more reliable there. Both methods are in our guide to calculating LTV for games and subscription apps.
Verify before you trust it
Before a churn number goes on a slide, run four checks.
- Customers lost should never exceed customers at the start. If they do, the numerator includes people who were not in the starting base.
- For the same starting customers and period, customer churn and customer retention should add up to 100%. If retention is 90% and churn is 20%, one of them is measured differently. In games the two do not have to add up, because day N retention and day N churn use different rules (see the games section above).
- The definition should match the previous period. If churn improved the same week someone changed the inactivity window or the denominator, check that change first.
- When a number looks surprising, check the tracking before you explain the business. A renamed event or a pipeline change causes many sudden swings.
How to calculate churn in a spreadsheet or in Agentic Engine
In a spreadsheet, put customers at the start of the month in column B, customers lost in column C and new customers in column D, one row per month.
- Monthly churn rate in column E is =C2/B2.
- Annual equivalent in column F is =1-(1-E2)^12.
- Customers at the start of the next month in column B of the next row is =B2-C2+D2, where column D counts new customers still active at the end of the month.
Format columns E and F as percentages and keep new customers out of the churn rate itself, as in the SaaS example. To track revenue churn, add the same columns for MRR.
For games and apps, a spreadsheet gets slow once you need churn by install cohort. In Agentic Engine, Retention Analysis takes a first event and a return event and shows day N retention and churn for each first-event cohort, by day, week or month. You can save the churn rate for a specific day as a project-wide metric, so other members of the project reuse the same definition. When a cohort's numbers drop, follow the documented next-day churn workflow and save the users who registered on the day of the drop, and the ones among them who did not log in the next day, as two result cohorts. From there you compare which level each group stopped at in Funnel Analysis and look at the paths the churned players took in Flows Analysis.
Frequently asked questions
What is churn rate?
Churn rate is the percentage of customers or revenue you lose over a set period. Customer churn counts accounts or users that left, and revenue churn counts the recurring revenue that left.
How do I calculate churn percentage?
Divide the customers lost during the period by the customers at the start of the period, then multiply by 100. For example, 50 lost out of 1,000 at the start is a 5% churn rate.
How do I convert monthly churn to annual churn?
If the monthly rate is steady, use annual churn = 1 − (1 − monthly churn)^12. A 5% monthly churn rate is about 46% a year. Multiplying by 12 gives a number that is too high.
What is the difference between churn rate and retention rate?
For the same starting customers and billing period, retention is the share of customers who stayed and churn is the share who left, so the two add up to 100%. Games and apps usually track day N retention since install, and there a player can be neither retained nor churned on a given day, so the two figures do not have to sum to 100%.
How do you reduce churn rate?
First find the point where people leave. Compare churned and retained users from the same cohort and find the step where they stopped. Then try a change on part of your users and keep a comparable group without it, often called a holdout group, so you can see whether the change made the difference. Early warning signals and how to respond to them are in our guide to churn prevention for subscription apps.
Where to go next
To find out why your churn rate moved, use churn rate analysis to break the number down by cohort and lifecycle stage. To put a value on the customers you keep, see how to calculate LTV for games and subscription apps. And to see what users did before they left, start with behavioral analytics.